Once you have built your website and started promoting it, you can start to learn more about the traffic you receive to it. Understanding your web traffic is essentially understanding the visitors to your website (i.e who they are, where they have come from and what they did when they got onto your site).
There are many tools you can use to understand more about your web visitors, some are free (e.g Google Analytics), and some are paid (e.g. Kissmetrics). In this post, we will take you through some of the main terms associated with web analytics and what they mean.
Hits – This term is often used incorrectly since many people think it means the number of visits to your website. A hit is actually a request to a web server for a file (e.g. an image file). Since a web page has multiple elements that need to be downloaded in order to be viewed, the hit number can be as high as 15 per page.
Visits – This is the number of times your website has been visited by people, if one person visits a website 4 times, it will be recorded as 4 visits.
Unique Visitors – A unique visitor is the number of individual visitors to your website within a specified time period. For example if one person visits a website 4 times, it will be recorded as 1 unique visitor.
Page Views/Impression – This is the total number of times a web page has been viewed. This represents when a visitor lands on your website and clicks through to view multiple web pages. Each of these web pages viewed is categorized as a page view/impression. If the same page is viewed more than once by the same person, it will be counted multiple times.
Pages/Visit – Pages per visit is the average number of pages viewed during a visit to your site. This is a useful metric to use when measuring how engaged a user is with the content on your website. Again, if the same page is viewed more than once by the same person, they will be counted multiple times.
Average visit duration/Time spent on site – This is the average amount of time (in seconds/minutes) users spend on your website.
Bounce Rate – Bounce Rate is a percentage that is calculated by taking the number of single-page visits (i.e. visits in which the person left your site from the entrance page without interacting with the page) as a percentage of the total visits.
Traffic Sources – A Traffic Sources report will breakdown where the visitors to your website came from (i.e. from what source did they find your website). Examples of Traffic Sources include:
- Search traffic from search engines such as Google and Bing. This can be broken down into organic traffic from natural search listings or PPC traffic from paid search campaigns such as Google AdWords.
- Referral traffic from other websites, blogs, social media, etc.
- Direct traffic from a user has typed your web address into their browser or arrived at your site from a bookmarked link.
- Campaigns from Social Media adverts and email marketing campaigns. You can use this report to measure the success of your individual marketing campaigns. If you have multiple campaigns running at the same time you can differentiate between them from this report by using tracking parameters in your links.
Audience Reports – Audience reports give you more insightful information about your website visitors, for example, you can find out what percentage are new users to your website and what percentage are returning users. You can also learn more about the country/city they are from, what browser they are using (e.g. Internet Explorer or Firefox) and whether they are visiting your site from a mobile device or desktop.
Conversion Rates/Goals – With some customization you can set up your analytics to measure conversions or the goals of your website. These could be:
- A sale or purchase
- A form completion
- A sign up to a service
- An appointment made
- An item downloaded
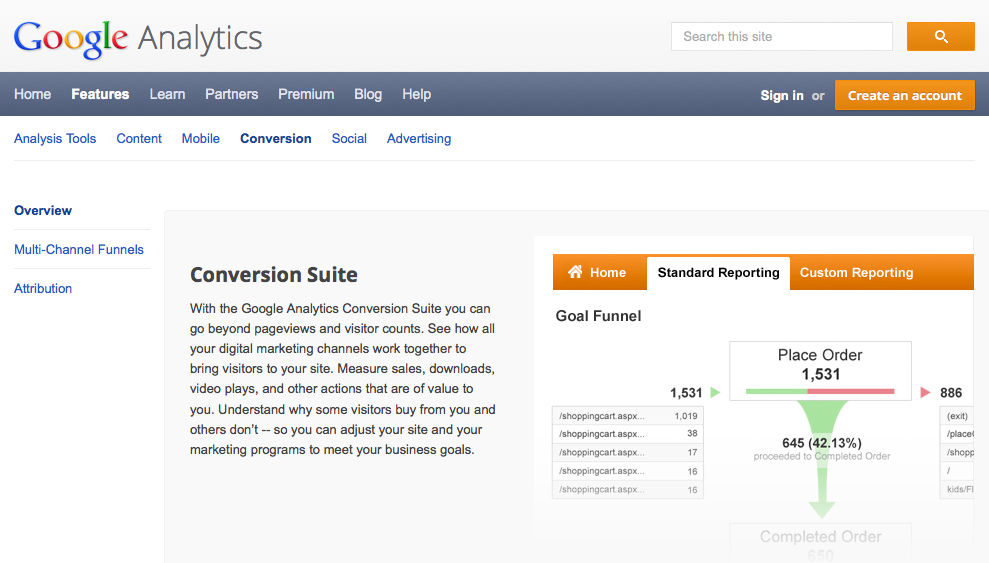
A conversion report will often show you how many people started on your conversion journey (e.g. they may have added an item to their basket), and then show you the number of people to go through the following steps until they have completed a purchase.
Conversion rates can be measured by: Total conversions/Unique website visitors X 100 = Conversion Rate (%)
Funnel drop off reports look at the steps of your customers journey and may be able to help you identify any points along the journey that are problematic and causing them to abandon their purchase.
Not every website will have the same goals, so before you start analyzing your web traffic, make sure you have defined your website’s goals so you know which data to concentrate on in order to measure your site’s success.
Useful information indeed not only to understanding web traffic but also the important role of it in business.
Pingback: 7 Words and Phrases to Avoid in Your Website Content | Yola
Pingback: Is your homepage content doing its job effectively? | Yola
Pingback: What your business Facebook page analytics are telling you: Part one | Yola